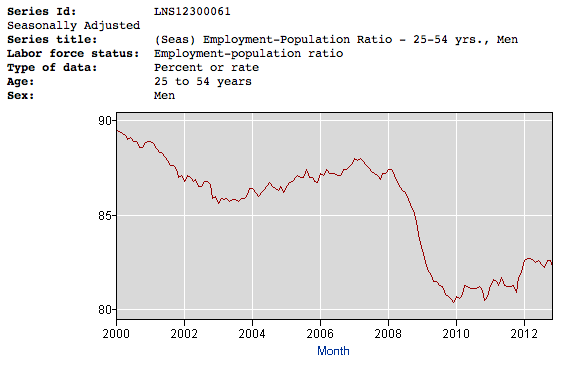
There's a new jobs report out this morning from the BLS which seems like an opportune moment to track the gender-specific employment/population ratios that I like to keep an eye on. In each case, these are the ratios for persons ages 25-54 (ie working age) so that the effects of demographics and retirement should be fairly minimal. The men's ratio from 2000 on is above, and you can see that the gradual recovery following the 2008/2009 great recession has largely stalled out in 2012, even though we are still very far from recovering the ground lost in the recession.
This is part of a larger pattern since the 1970s, as this longer-term graph shows:

It used to be arguable that this trend in the men was being partially driven by the rise of female employment: women either taking the jobs of men, or supporting non-working partners by working themselves, or both. However, the female employment/population ratio peaked in about 1998 and now seems to have begun declining also:

Focussing in just on the years since 2012:


5 comments:
Hi Stuart-
I'd be interested to hear more about 'at least not in a way BLS can count'. There's a difference between 'not working' and 'working in the black market', and I wonder if there's a way to tell.
Completely anecdotal evidence from WA here - in the years since about 2005, I have noticed that many, or perhaps even most of my male family members and friends have been working many fewer hours in the formal economy and picking up many more under the table. For the most part, this affects the younger generation, and happens like this: hours are cut, and the person picks up side gigs doing the same job for slightly less money... people I know who do this are mostly blue collar workers in trades like auto mechanics, landscaping, electric and plumbing, and carpentry. Most of the people I know still have a formal job,m but it used to be full time and now it's part time.
Among women I know, many (including myself) have picked up occasional gigs doing something they happen to be good at - in my case, teaching English to Spanish speakers and vice versa.
Oh P>S> when I say "slightly less money" I mean at a slightly lower cost to the buyer - often the worker is making more per hour than their boss paid them, but they don't want to take the risk and invest in a legal business on their own.
Probably the single largest reason for the decline in both male and females participating in the workforce is the increasing number of them attending college. More people in college = more people not working.
I share Aimee's experience.
@Unknown -- according to the census bureau (http://www.census.gov/compendia/statab/2012/tables/12s0281.xls), there were about 6 million people age 25 and older enrolled in college in 2009, vs. 3 million in 1980. That accounts for some of the decline.
@Greg -- I also have the same experience, but we're a self-selected group here. The bit of reading I've done so far suggests that 10-20% of transactions might be off the books, but I don't know the breakdown or change over time
Post a Comment