
So I'm sure you've all been waiting with bated breath, like me, wondering, "What did global oil supply do in August?" Did the post-great-recession-recovery resume, as July suggested? Or has it peaked again and is starting to go down?
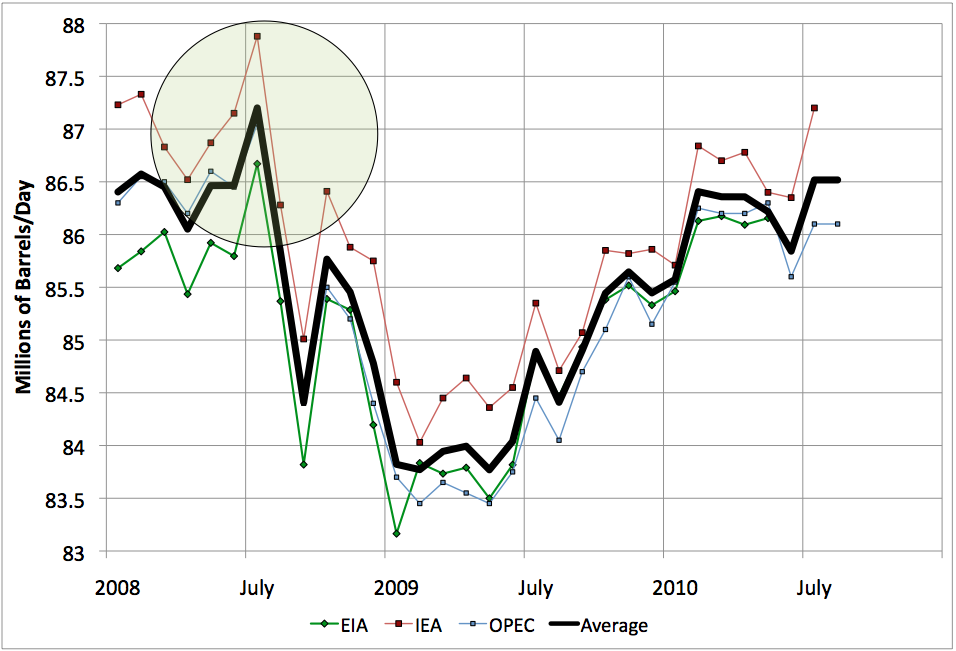
Well, the wait is over, with the OPEC Monthly Oil Market Report hitting the streets today. Their graph is up above, and as you can see (black line), there is some revision from last month, with the big July bump revised down in significance. The picture that emerges now is that global oil production was recovering from about Feb/Mar 2009 to about February of 2010, and then has flattened out and stagnated.
Here is the OPEC data in the context of the other two data sources:
The IEA will hopefully report their August number tomorrow, so I'll update this graph then.

4 comments:
Hi Stuart,
Posted a bit over at TOD about the vehicle fleet buildout in China, might be of interest. Pick your poison: 200, 217, or 282 million light vehicles in 2020?
As I point out they were up 750 kb/d YOY in consumption for June. How that can translate into flat production I'm not sure, maybe they're draining inventories there or elsewhere? Or demand has keeled over since June.
If the black line is total world production, it would appear that in Nov of 09 and from Jan of 10 on we have equaled or exceeded the peak in Oct of 08.
Huh? I thought global yearly production peaked in 05 and global monthly production peaked in Oct 08.
Did I miss something here?
Glenn: Yeah, the monthly peak was in July 2008, and it's fallen off the beginning of OPEC's graph.
October was sort of the dead-cat bounce on the way down.
Post a Comment