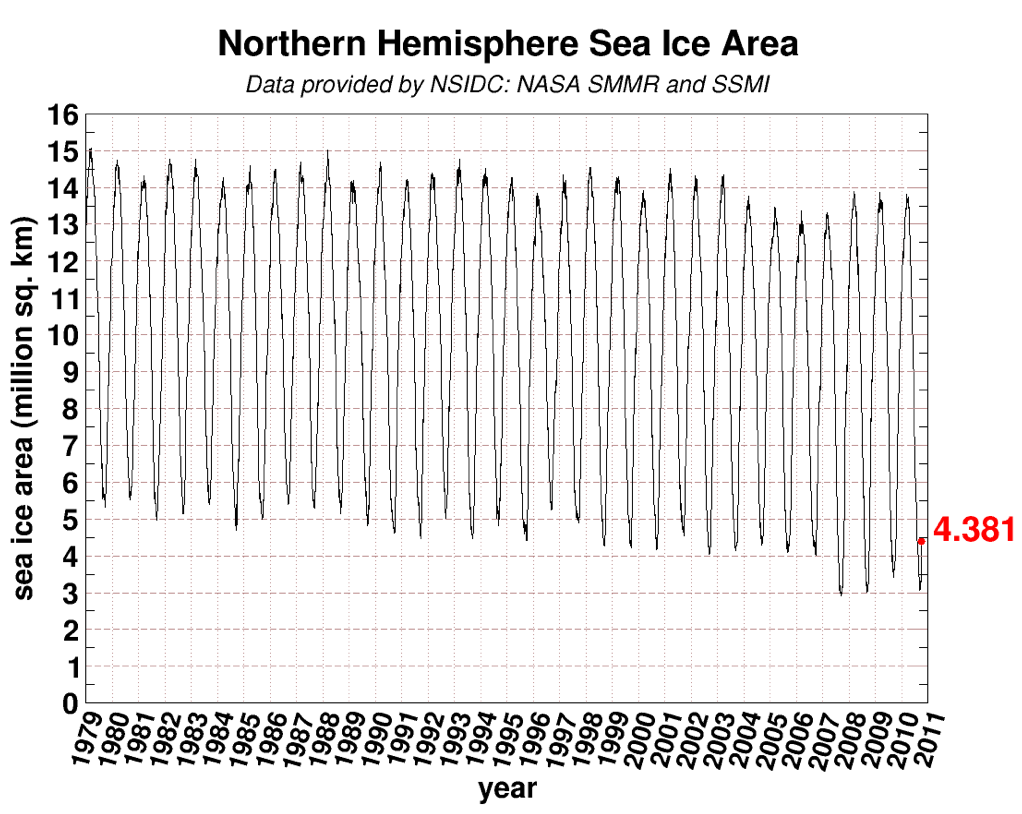
October seems like a good time to check in on the state of affairs with north polar melting, since we will be for sure past the minimum ice extent (which generally occurs in September). I get my data from Cryosphere Today, from which the above graph comes. As you can see, 2010 didn't quite break the 2007 record. Still, like 2008, it almost equalled it. There's no sign of going back to the levels of 4-5 million km2 that we saw as recently as the 1990s and early 2000s.
I took the annual minimum for each year from the chart above and plotted it on its own graph:

The blue line is a linear fit to all the data. However, the data is pretty clearly not linear, as evidenced by what happens if you fit just the data after 1990 (orange), or just after 2000 (red).
To me, this data is extremely simple, and it doesn't require any fancy math or stats to see that this is on a path headed toward zero, and that the rate is accelerating. Physically, the explanation for the increasing decline is that the thickness of the ice has also been declining, so it gets easier and easier to melt it faster as it gets thinner.
The start of the x-axis at 1965 may seem a little odd, but that was the year I was born. When I was a kid, and even into my twenties and early thirties, the existence of two ice-bound poles was simply an incontrovertible permanent fact about planet earth. Now, it seems likely that within my lifetime (I'm, perhaps rather optimistically, going for 90 on this graph), we will only have one icy pole. For something as large as an entire planet, the pace of change is breathtaking.
Any time you experience even a smidgen of doubt about the reality or importance of climate change, just head over to Cryosphere Today and stare at the North Pole data.
And then look at this massive area of sea ice, right next to Greenland:

that will be flipping from an albedo of 0.5-0.7 to one close to zero. That is, right now the summer sea-ice reflects about 2/3 of incoming sunlight straight back out to space. With that gone, almost all the sunlight on the pole will be immediately absorbed and warm the polar ocean.

6 comments:
And what's the trend post2007? (Yes, I know, paucity of data makes it likely a blip but...)
Sam:
Over intervals that short, the fit will be dominated by the noise and will be meaningless.
"With that gone, almost all the sunlight on the pole will be immediately absorbed and warm the polar ocean." Leading to more evaporation and more precipitation falling as snow on the surrounding land. What do the models say about the effect of that?
rks:
Snow falls in the winter, when there is not much insolation anyway. The reflective effect of increasing the thickness of the layer of snow is pretty much nil.
Ice will still form on the Arctic Ocean in the winter for decades to come. Snow is a pretty good thermal insulator, so snow sitting on the ice acts to slow heat loss from the ocean during the Arctic night. More snow will increase this effect.
RKS:
It's a good question, and I don't fully know the answer. I do know that there is an expectation here in the north east US that winter snow storms due to lake effects snows from the Great Lakes will get worse for the next few decades (a point I alluded to, with source, here). I would assume that the same would happen in early winter from an ice free arctic (but I don't know for sure). As Greg points out, however, the effect on the energy balance won't be very great since there is very little insolation in northern latitudes by then.
There are only 35 data points in the full set, so statistically the trend to the full set is pretty shaky. Even more so since fitting a straight line to something that doesn't seem to be a straight line set is pretty shaky. An exponential trend would seem more appropriate, or whatever produces the best R².
Post a Comment