
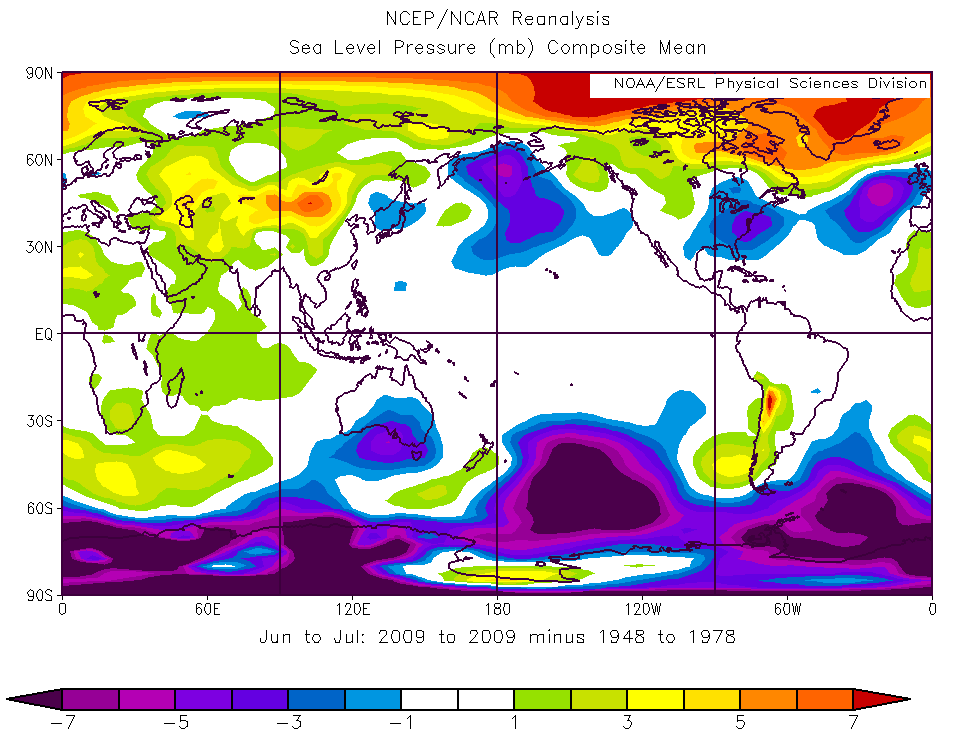
I wanted to cross-check for myself some of the work Chris Reynolds has done looking at changes in weather patterns since 2007 (the beginning of the recent sea ice collapse). Accordingly, I went to this page which allows you to make maps from the NCAR/ESRL weather reanalysis product (which basically uses meteorological weather forecasting models to integrate all available weather observations and then provide a consistent set of weather variables over time and space). I started by producing the difference between summer sea level pressures in 2007-2012 and that in 1948-1978 (the first thirty years available in the dataset). That gave the map above (I wanted to look at the whole globe for context). You can see the pattern that Chris is talking about - the higher pressure over Greenland and the lower pressure in a track around the Arctic - particularly the UK, northern Siberia, and the eastern US and north Atlantic.
However, there is an equally pronounced feature of higher pressure over northern China, and even an even more striking drop in pressure in Antarctica. The first thought was to ask if these are also post 2007 developments or were already occurring? Thus produce the map from 2000-2006 (also Jun-Aug) versus the baseline climatology of 1948-1978:

Clearly the higher-pressure in Mongolia and the lower pressure in Antarctica were preexisting (and will not be considered further here - though they are interesting observations for discussion another time).
Next question - is this only a summer phenomenon or also at other seasons? First up, fall (again 2007-2012 versus 1948-1978):

Next, spring:

Again, no sign of the new pattern. So it's only a summer thing. This prompted a look month by month to see how this pattern develops and changes. First, May:

Just a slight hint of higher Greenland pressures in May. Then June:

Ah - pattern fully clear in June. July:

Pattern a little weaker in July but still fully evident. Now August:

Pattern still visible but breaking up by August. And September:

Completely gone by September. So what we are talking about is an early summer pattern - starting in late May, peaking in June/July, and then fading in August. Finally, here are the individual years since 2006 for comparison with the overall pattern (all done as June/July averages versus 1948-1978).
2006, the last year with a "still on the linear trend" Arctic:

Note the pattern is completely missing (with the possible exception of a very small spot on Greenland).
Then 2007, the first year of the big collapse:

In that year, the UK and northern Russia got the biggest pressure drops.
2008:

2009 - the whole Arctic has very high pressure:
2010 - the high over Greenland is less pronounced, but the track of lower pressure across northern Russia, Alaska, and the eastern US is still visible:

Then 2011 - pattern very clear again (note that this was a year in which the northern US was very wet and the southern US had a big drought):

Finally 2012, in which the UK had the worst summer in a hundred years and the US had a severe drought:

The obvious questions are: why? and will it continue?

11 comments:
My eyeball (not degreed in climate science) says: hmm, Mongolia and Greenland are about 180 degrees apart, on opposite sides of the low pressure. Nodes and antinodes? A great big hum?
And looking at June-July-August-September, I notice a low in September. Is this perhaps a timing-related thing, where a high occurring later in the summer now occurs earlier?
Good luck making any sense of this.
Obvious initial comment is that the early data around Antarctica is probably unreliable - you may simply be seeing model climatology there.
Yes, the now edited out jet stream wiki used to say ~ 'since 2007 the JS has moved south over the UK during the summer'.
There are some very good animations of the gulf stream based on the Mercator satellite showing the huge shifts in flow around Greenland i.e. into the Davis Strait, Hudson Bay, Baffin Bay.
This is reflected in the water temperature.
Here is one source of info for the Arctic.
https://sites.google.com/site/arcticseaicegraphs/
You should also have a look here:
https://www.facebook.com/ArcticMethaneEmergencyGroup
William - thanks.
Sea level pressure is only half the story. It would be interesting to overlay upper level pressure distributions with a jetstream map.
I wonder if an excess of available energy in the north polar region is driving brief reversals in what would otherwise be typical polar cell circulation?
The timing fits with the change in melting pattern beginning in May of 2007. Something big changed:
http://neven1.typepad.com/.a/6a0133f03a1e37970b017617892c50970c-pi
I suspect that it may be the ice volume dropped below a critical volume which speeds melting to a much earlier point in the year
http://neven1.typepad.com/.a/6a0133f03a1e37970b0177446fc134970d-pi
The Arctic Ocean is 'opened up' in May, much earlier, which shifts the atmospheric high to the cold elevated Greenland ice cap.
"The Arctic Ocean is 'opened up' in May, much earlier, which shifts the atmospheric high to the cold elevated Greenland ice cap."
Fred,
That's sort of what I was thinking too...
What is now open ocean or very thin ice should be contributing a larger quantity of heat energy to the overlying air mass forcing a tendancy towards lower surface pressure...
The Greenland ice sheet, meanwhile, is the relative cold spot in the arctic circle which should continue to act to cool the overlying air mass and force a tendancy towards higher surface pressure...
Thanks for your comments Stuart.
I don't disagree with most of what you've written, I just have one area of disagreement.
1)
In the analysis where I went over the NCEP/NCAR data from the 1950s and found that this pattern was unique in the period, I came to the conclusion that the really persuasive pattern was the central high over Greenland surrounded by a halo of low pressure anomalies, part of which pattern is low pressure persistently over the UK in summer. It was this I took as confirmation of the cool wet summers that the UK has had since 2007. However I did not find patterns in other parts of the world to be persuasive, these may however by elucidated by better statistical analysis - which is beyond me. One exception here is a persistent low pressure anomaly over Nepal and the bordering regions of neighboring countries. So I am not convinced about linking weather events elsewhere with this pattern. Not yet.
I can't say more at present due to obligations. I'll give you a shout when the new information can be divulged.
I don't know if you read the comments but you may want to check out Hanna et al, which is published.
Hanna et al, 2012, "The influence of North Atlantic atmospheric and oceanic forcing effects on 1900–2010 Greenland summer climate and ice melt/runoff."
http://onlinelibrary.wiley.com/doi/10.1002/joc.3475/abstract
"We have shown that summers 2007–2010 tropospheric pressure patterns reflect an unusually (for 1948–2010) blocked meridional circulation over Greenland. This kind of meridional pattern, differing from the NAO/Arctic
Oscillation or Pacific North American-like pressure patterns,
has been noted to have emerged more generally for the pan-Arctic atmospheric circulation during 2000–2007 compared with the preceding few decades and may be symptomatic of natural climate variability as well as anthropogenic global warming (Overland et al., 2008)."
The 'meridional pattern' is the Arctic Dipole, which plays a key role in sea ice loss.
http://dosbat.blogspot.co.uk/2011/08/arctic-dipole-sea-ice-loss.html
e Brutto,
Research shows that in models Rapid Ice Loss Events tend to be preceded by large influxes of warm ocean water (1 to 2 years in advance). So I wondered if there was a way of looking out for this in the current Arctic.
I looked at Mercator Ocean's model, using salinity as a proxy for Atlantic warm water influx. After a 'My God!' moment, I realised that the massive increase I'd seen was between different versions of the model (there are three version changes in the series IIRC).
So what I'm saying is treat Mercator Ocean with caution. It's useful, but watch out for version changes. The version is given on the image plots IIRC.
I have been looking at Mercator since before the version changes.
Perhaps predictably the version change occurred after I and no doubt other noticed the changes...
There was no operational reason to change both the scale and colour scheme marginally i.e. just enough to make people doubt their eyes.
The underlying data which is available does not lie as yet.
Similarly when the ice story broke big recently the models publicly available via a US Navy server became mysteriously unavailable for several days.
We checked and the server was still up just filtering all the ports.
Now it is back - go figure.
I posted this over at Dosbat, and was wondering if I was on the right track.
"This is a troubling development. Current projections of Greenland ice sheet loss assumed that increased precipitation would partially offset increased melting due to rising temperatures. The presence of semi-permanent summertime high pressure over the Greenland summit, however, would promote sinking air and reduced moisture/precipitation over the ice sheet. I'm not sure if potential increased wintertime precipitation would be enough to compensate for decreased summertime precipitation. Although I'm not sure, I would assume the winter is the dry season there with the air being too cold and dry to support snowfall. I guess you can throw out any existing calculations on the Greenland ice sheet mass balance. The models have consistently underestimated the speed of changes in the Arctic. It's starting to become apparent that even temperatures sustained at today's levels, on the long run, would result in a seasonal (perhaps year-round) ice-free Arctic Ocean and little, if any, glacial ice over the Greenland subcontinent."
Post a Comment