Wednesday, November 30, 2011
Seasonally Adjusted Global Trade is Contracting
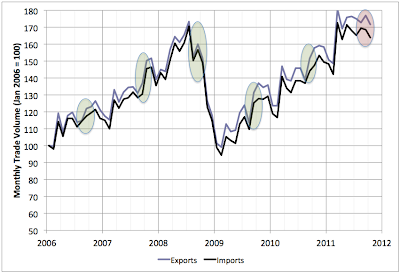
Yesterday I posted this chart of monthly global trade:
and noted that the usual fall surge of global trade was missing.
To make the point clearer I wanted to seasonally adjust the numbers which is a bit tricky both because the series is short and because there's a giant anomaly in the middle from the 2008 financial crisis. To get around this, I cut the series into two pieces - Jan 2006 to Jun 2008 and Feb 2009 to Jun 2011 (leaving the financial crisis part on the cutting room floor). I separately fit quadratics to each of those regions and used those fits to derive seasonal adjustment factors, which then look as follows:
I take the reasonable agreement between imports and exports (which were adjusted separately) as evidence that the procedure is not crazy. One can also tell a reasonable narrative about what these mean: there are surges in the fall (as merchandise for Christmas is shipped) and again in the spring as summer retail goods are shipped.
I then seasonally adjusted the original series which looks as follows:
One can see that indeed we seem to be at the onset of another downtown in world trade.
The remaining question is how deep this new downturn is going to get.
Labels:
global trade,
recessions
Subscribe to:
Post Comments (Atom)


3 comments:
It's funny to compare that to oil prices. The causation probably runs both ways, but the correlation looks pretty high.
First it was our turn, now it's Europe's turn, then China? Everyone gets an opportunity to drag the world economy back into recession. And oil prices act as a brake on growth each time. What a mess.
QE2 caused outrageous inflation in China so China restricted inflation by hiking bank rates to reduce lending. Small businesses in China suffered from the lack of liquidity. Today China reversed a bit by cutting the reserve requirement ratio for its commercial lenders on Wednesday for the first time in nearly three years to ease credit strains and shore up an economy running at its weakest pace since 2009. The very same day WTI crude closed up over $100 so China's action may have brought some inflation back.
I'm not quite clear what you mean by "I separately fit quadratics to each of those regions and used those fits to derive seasonal adjustment factors".
The chart of seasonality seems to show growth (a linear regression would slope upwards). Did you adjust for the distortion of seasonality caused by longterm growth, as I talked about earlier?
I would model this with 3 linear regressions; then subtract those trends from the actual data; then identify the seasonality factors from the residuals; then put those two factors together in a single forecast line; and chart the forecast line vs actual.
The divergence from the forecast would become very clear.
Post a Comment