Friday, April 16, 2010
What is Waxman-Markey Really Doing?
I have been trying to dig in and find out in more detail what the Waxman-Markey bill really does; I was on my post-Oil-Drum hiatus when it was initially being developed and didn't pay enough attention. It's not easy to get things straight. The bill is 900+ pages, so reading the thing itself is obviously a major project. Most of the various summaries I've looked at are confusing, internally inconsistent, or contradict one another. I obviously need to get up to speed on this stuff, particularly with the Senate threatening to maybe actually pass legislation of its own. However, there may be quite a bit of "WTF is this?" kind of blogging for a while - I apologize if so.
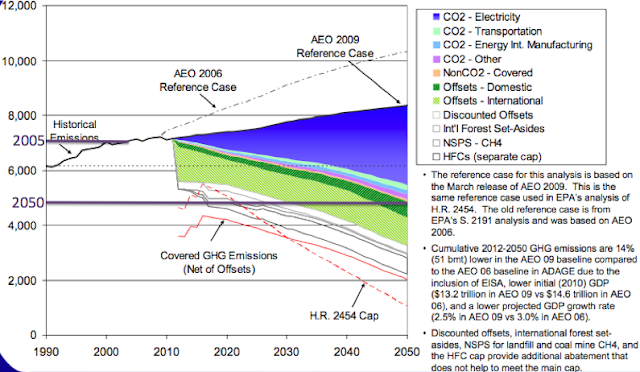
The most useful resource I've found so far is this analysis of the legislation by the EPA, which probably should win some kind of award for the highest density of information on Powerpoint slides in the history of the known universe. The figure above is taken from there, (with annotations by me in purple). If I'm understanding this correctly, the figure shows US historical emissions (in million tonnes of CO2 equivalent, rather than the gigatonnes of carbon I generally use. The conversion factor for CO2 to C is roughly 12/44 if you've forgotten your high school chemistry). Also on there is the EIA's Annual Energy Outlook reference scenario from 2009, which is basically the EIA's current best guess at business as usual out to 2050. Then the colored bands show the EPA's estimates of the various kinds of reduction that the legislation would cause.
The first, and perhaps most important thing to understand is that actual reduction of total emissions is only from my "2005" line to my "2050" line - after that we get into offsets. It's more like a reduction by about a third, than an 85% reduction. This interpretation is confirmed by the following graph which shows primary energy consumption under the business-as-usual case, and the main Waxman-Markey scenario:
The top of the orange is the fossil fuels; above that is nuclear and renewables.
As you can see, what is really being proposed here is to have the utility sector and large industry convert away from fossil fuels, while leaving consumers largely alone, except for spurring some modest efficiency gains. In the top figure, you can see that almost all the emissions gains come from CO2 - electricity, and correspondingly in the primary energy graph, coal largely goes away. Meanwhile, oil consumption barely declines at all, and natural gas consumption declines moderately.
In particular, the cap and trade scheme is only applied to large stationary sources of CO2. It is not applied to either transportation or building energy use.
So then much of the alleged gains come from various forms of "offsets", forest set-asides, etc; many of them international (ie we are hoping to pay somebody else to do our emissions reductions for us). Some such things could be perfectly legitimate, but there's clearly an awful lot of potential for fudging in the details. I will try to get into the weeds of that in future posts.
If I'm confused about anything here, let me know in comments.
Labels:
carbon emissions,
climate change,
waxman-markey
Subscribe to:
Post Comments (Atom)


2 comments:
The fantasy of CCS corrupts thinking. It prevents people seeing the obvious fact that the place to tax carbon is as it comes out of the ground. You also need to tax it off the ship if it comes from a lower taxing place, and tax goods made in lower carbon tax countries. If CCS happens then the people doing that would get the tax money back. Taxing emissions is impossible because carbon cycles in and out of the atmosphere at a high rate.
Australia and America are big coal exporters. We should get together on this. Joke. No politician is taking on the coal industry in either country. It remains a fact that only energy cheaper than coal (once it's going) will stop coal: and that means nuclear.
Just in case folks don't know....the EIA published an analysis of Waxman-Markey on the request of bill's authors.
Post a Comment